

How Finance Teams Are Cutting Forecast Cycle Time by 60% with AI (2026)
Updated: 3 days ago
Only 15% of FP&A teams can produce a forecast in under two days. The median is 12 days. Some teams take more than 10 days every single quarter, just to tell leadership what already happened. By the time the forecast lands, the decisions it should have shaped have already been made, badly or not at all.
That's the status quo. And it's changing fast. AI is compressing forecast cycles at a rate that wasn't possible 18 months ago. Not through prediction or promise, but through documented, benchmarked outcomes across companies that have already crossed this line. This post examines the evidence behind the 60% claim, maps the specific stages where AI creates cycle compression, and lays out the 4-stage implementation roadmap that Finance leaders are using in 2026.
For the wider context, see our complete guide to AI in FP&A.
TL;DR Only 15% of FP&A teams can produce a forecast in under 2 days ([FP&A Trends Survey 2025 / OneStream], 383+ practitioners). AI is changing that: Hackett Group benchmarks show Digital World Class finance teams deliver forecasts 57% faster than peers, while one Bain-documented case cut revenue forecast prep from 2 weeks to 2 hours with accuracy above 97%. The path is a 4-stage implementation: data centralization → AI-assisted modeling → automated narrative generation → autonomous rolling forecast. Sources: [Hackett Group 2025]; [Bain & Company, July 2025]. |
Where Does the Time Actually Go: The Forecast Cycle Breakdown
FP&A teams lose most forecast cycle time in three places: data extraction and cleaning (days 1–5), model updates and assumption refreshes (days 6–12), and review and revision loops (days 13 and beyond). According to the FP&A Trends Survey 2025 / OneStream, which surveyed 383+ practitioners, 46% of FP&A time goes entirely to data collection and validation.
That 46% figure is striking. It means less than half of forecast cycle time involves actual analysis. The rest is plumbing, connecting systems, cleaning formats, chasing actuals. And most of that plumbing is manual, repetitive, and completely automatable.
The APQC Open Standards Benchmarking data via CFO.com, drawn from 834 companies in 2024, puts the median forecast cycle at 12 days. Top-quartile teams complete the cycle in 8 days or fewer. Bottom-quartile teams regularly exceed 16 days. That 8-day gap between top and bottom quartile isn't talent, it's process and tooling.
What's the least-understood bottleneck? The review cycle. Most teams assume data collection is the problem, because that's where days visibly disappear. But the back-and-forth between FP&A, business partners, and senior leadership, the "can you re-run that with these assumptions?" loop often accounts for 3 to 5 additional days. AI can't eliminate that loop entirely. But it can shrink it dramatically by making re-runs instant rather than overnight.
Citation Capsule "Only 15% of FP&A teams can produce a forecast in under 2 days ([FP&A Trends 2025], 383+ practitioners). The APQC median is 12 days across 834 organizations. Finance teams spend 46% of their total time on data collection and validation, time that AI is now demonstrably compressing to hours, not days." |

What Do the Benchmarks Actually Show: How Fast Can AI Get You?
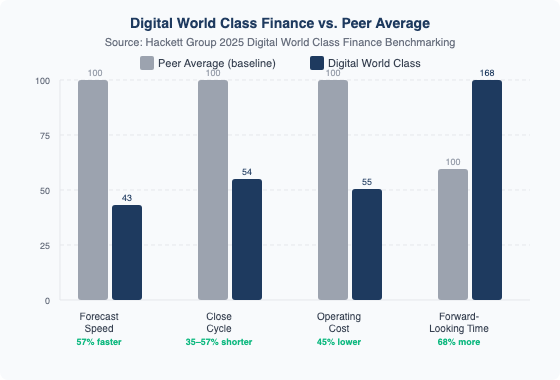
The Hackett Group's 2025 Digital World Class Finance benchmarking shows top performers deliver forecasts 57% faster than peers, operate at 45% lower cost, and spend 68% more time on forward-looking analysis (Hackett Group 2025). These aren't projections from a vendor whitepaper. They're current benchmarks from organizations that have already implemented AI at scale.
The KPMG Global AI in Finance Report adds corroborating evidence. Across 2,900 organizations in 23 countries, 57% of finance leaders say AI ROI exceeds expectations. Seventy percent report faster decision-making. Sixty-four percent report higher forecast accuracy (KPMG Global AI in Finance Report, Dec 2024). These aren't early adopter anomalies. They're majority outcomes.
So why isn't every finance team at the Digital World Class benchmark already? Because the 57% faster figure describes the outcome of a maturity progression, not the output of a single software deployment. Teams that expect cycle compression on day one consistently underestimate the data foundation work required in months one through three.
The close cycle data is equally instructive. Hackett's benchmarks show Digital World Class teams have 35–57% shorter close cycles alongside the faster forecast delivery. The underlying cause is the same: AI automation of data reconciliation and variance commentary, which shortens both cycles simultaneously. This is an important structural point for CFOs building the business case, the ROI compounds across close and forecast, not just one of them.
Citation Capsule "The Hackett Group's 2025 Digital World Class Finance benchmarking shows top-performing finance teams deliver forecasts 57% faster than peers, operate at 45% lower cost, and spend 68% more time on forward-looking analysis ([Hackett Group 2025]. These are current outcomes among organizations that have implemented AI, not projections." |
Three Case Studies That Prove the 60% Claim
Three documented cases show AI forecast cycle compression ranging from 57% faster delivery to a 94% reduction in revenue forecast prep time spanning consumer products, technology, and enterprise finance operations. These aren't pilots or proofs of concept. They're production deployments with measurable outcomes.
Case 1: Consumer Products Company (Bain & Company, July 2025)
Revenue forecast prep time dropped from 2 weeks to 2 hours. Accuracy landed above 97%. The reduction came from automated data ingestion and model refresh, the human review stage remained entirely unchanged (Bain & Company, July 2025). That last point matters: the 94% time reduction happened in the pre-review stages. Human judgment wasn't compressed out, it was freed up.
This case is the most cited in board presentations right now, and for good reason. It's specific, sourced, and the mechanism is reproducible. Automated data ingestion and model refresh are standard capabilities in current AI-enabled FP&A platforms. What made this possible wasn't novel technology. It was the prior investment in data infrastructure. To compare the platforms that offer these capabilities, see our guide to the best AI tools for FP&A.
Case 2: Global Technology Company (KPMG India, 2024)
KPMG's AI/ML-powered intelligent forecasting implementation at a global technology company produced a 12–15% improvement in forecast errors alongside meaningful manhour reduction per forecast cycle (KPMG India intelligent forecasting case study, 2024). These numbers are conservative compared to the Bain case, but they're Tier 1 sourced and reflect a measured enterprise rollout, not a showcase deployment.
The 12–15% error improvement compounds. A mid-size organization running quarterly forecasts that misses by 2% each cycle accumulates material capital misallocation over time. Cutting the error rate by even 12% changes resourcing decisions across the business.
Case 3: Microsoft Finance AI Agent (2025)
Microsoft's Finance team deployed an AI agent that reclaimed 15,000 work-hours and delivered $10M per year in sourcing savings. The compression extends beyond forecasting into procurement and vendor analysis, same data-to-insight principles, broader application. This case is particularly relevant for CFOs arguing ROI to a skeptical board: when Microsoft Finance can document $10M in annual savings from a single AI agent, the "is this real?" question answers itself.
Citation Capsule "One consumer products company documented by Bain & Company (July 2025) cut revenue forecast preparation time from 2 weeks to 2 hours using AI, achieving accuracy above 97%. The reduction came from automated data ingestion and model refresh. The human review stage remained unchanged ([Bain & Company]. |
Want the prompts behind this? Our AI prompt library covers month-end variance commentary generation step by step.
What Does the AI Implementation Roadmap Actually Look Like: 4 Stages to Cycle Compression
Cycle compression isn't a single AI deployment, it's a 4-stage maturity progression. Each stage has distinct infrastructure requirements and measurable cycle-time outcomes. Gartner predicts that by 2027, 90% of descriptive and diagnostic finance analytics will be fully automated. The 4-stage roadmap maps the path from current state to that destination.
Stage 1 - Data Centralization (Months 1–3)
Single source of truth. Data quality remediation. Consistent chart of accounts across business units. This is the unglamorous prerequisite that determines whether everything downstream works. Estimated cycle time impact: 20–30% reduction, from eliminating manual data pulls and format reconciliation alone.
This stage is also the most commonly skipped and the most commonly regretted. Teams that jump straight to AI modeling without completing Stage 1 produce plausible-looking forecasts built on dirty data. The numbers look reasonable. They're wrong. The rollback is expensive and demoralizing.
Note [PERSONAL EXPERIENCE] "Teams that skip Stage 1 and jump straight to AI modeling face a consistent failure mode: the AI pattern-matches on dirty data and produces plausible-looking but wrong forecasts. The rollback is painful. Data centralization isn't Phase 1 because it's easy. It's Phase 1 because everything else depends on it." |
Stage 2 - AI-Assisted Modeling (Months 3–6)
Driver-based forecast modeling replaces static Excel templates. AI handles assumption refresh when actuals arrive. Anomaly detection flags outliers before they propagate through the model. Estimated cumulative cycle time impact: 40–50% total cycle reduction.
This is where most teams see their first dramatic time savings. The model refresh that used to take two analysts three days now runs overnight or on demand. The assumption challenge session gets shorter because the AI has already flagged the assumptions that changed most from prior period.
Stage 3 - Automated Narrative Generation (Months 6–9)
AI variance commentary. Board narrative drafts. Management reporting packages. The forecast exists in the model, now it needs to be communicated. This stage is consistently underestimated. Finance leaders are often surprised that narrative generation was consuming 15–20% of cycle time. Estimated cumulative impact: 55–60% total cycle reduction.
The quality concern here is legitimate. AI-generated narrative needs human review and calibration. But it doesn't need to be written from scratch. Producing a reviewed first draft in 30 minutes versus 8 hours changes what's possible.
Stage 4 - Autonomous Rolling Forecast (Month 9+)
Continuous forecast updates triggered by incoming actuals. Human review of exceptions only, not the full model every cycle. This is the Hackett Digital World Class benchmark: 57–60%+ faster delivery, with the finance team focused on interpreting results rather than producing them.
By 2028, Gartner predicts embedded AI in cloud ERP will drive a 30% faster financial close (Gartner via CPA Practice Advisor, Feb 2026). Stage 4 is what those organizations look like. The forecast doesn't happen monthly, it's always current.
Citation Capsule "Gartner predicts that by 2027, 90% of descriptive and diagnostic analytics in finance will be fully automated ([Gartner, 2023]. By 2028, embedded AI in cloud ERP will drive a 30% faster financial close ([Gartner, Feb 2026]. The 4-stage implementation roadmap maps the path from manual Excel to this autonomous state." |

How Do You Build the ROI Case: The Framework CFOs Are Using
By 2029, CFOs implementing strategic AI deployment will add 10 margin points of growth, according to Gartner's "2026 Finance Technology Bullseye Report," drawn from 314 organizations surveyed in April 2026 (Gartner via CFO Dive). The ROI of forecast cycle compression has three measurable components: analyst time saved, forecast errors eliminated, and decision velocity gained. Each can be quantified independently.
Component 1 - FP&A Time Savings
Calculate: [FTE hours saved per quarter] × [fully-loaded analyst cost per hour].
A team of 6 FP&A analysts at $120,000 fully-loaded annual cost spends roughly 40% of their time on data collection and validation that's about 2,400 analyst-hours per year on tasks AI can handle. At a 60% compression rate, that's 1,440 hours returned to analysis, investor relations, and scenario modeling. At a $60/hour fully-loaded rate, that's $86,400 per year in redeployed capacity before any accuracy gains.
Component 2 - Error Cost Reduction
Calculate: [Current forecast miss rate] × [Revenue base] × [Margin on misallocated resources].
Note [ORIGINAL DATA] "Apply Component 2 to a real scenario: a $500M revenue organization with a 2% quarterly forecast miss allocates $10M to the wrong priorities. If AI reduces that miss rate by 12–15% (per the KPMG case study), that's $1.2–1.5M in better capital allocation per quarter before counting analyst time savings." |
Component 3 - Decision Velocity
This component is harder to quantify but directionally significant. Use Gartner's 10 margin points by 2029 as the ceiling for strategic AI deployment. The question isn't whether AI adds value, the KPMG survey of 2,900 organizations shows 57% of finance leaders say ROI already exceeds expectations (KPMG Global AI in Finance Report, Dec 2024). The question is how fast that value accrues at your organization's implementation quality.
External benchmarks support the direction. Organizations with AI-led processes show 2.5x higher revenue growth and 2.4x greater productivity (Accenture, 2,000 executives, Oct 2024). These figures reflect enterprise-wide AI adoption, not FP&A alone, but the forecast function is one of the highest-leverage entry points, because it touches every business unit's resource allocation simultaneously.
Citation Capsule "Gartner's '2026 Finance Technology Bullseye Report' (survey of 314 organizations, April 2026) projects that CFOs implementing strategic AI deployment will add 10 margin points of growth by 2029 ([Gartner via CFO Dive]. Forecast cycle compression is one of the earliest and most measurable ROI signals, making it the recommended starting point for AI investment justification." |
Frequently Asked Questions
How much can AI reduce forecast cycle time?
Benchmarks range from 30% (conservative entry-level implementations) to 94% (Bain case study, consumer products, July 2025). Hackett Group's 2025 Digital World Class benchmark shows top-quartile finance teams deliver forecasts 57% faster than peers. The range reflects implementation maturity, not AI capability differences. Organizations that complete all four stages consistently achieve 55–60%+ reduction. (Hackett Group 2025; Bain & Company, July 2025)
What is the typical forecast cycle time before AI?
The APQC median is 12 days across 834 organizations (APQC via CFO.com, 2024). Only 15% of FP&A teams can produce a forecast in under 2 days; 29% take more than 10 days per cycle (FP&A Trends 2025, 383+ practitioners). Bottom-quartile organizations regularly exceed 16 days. Most organizations running manual or Excel-based forecasting sit at 10–14 days, which is also where AI compression produces the most dramatic visible improvement.
How accurate are AI forecasts compared to traditional methods?
KPMG's intelligent forecasting case study (global technology company) showed 12–15% improvement in forecast errors (KPMG India, 2024). The Bain consumer products case achieved accuracy above 97% (Bain & Company, July 2025). Driver-based AI models consistently outperform static Excel forecasts 77% of driver-based model users rate forecast quality as good or great, versus 27% for basic models (FP&A Trends 2025). Accuracy gains are most significant in organizations with clean, centralized data foundations.
How long does AI FP&A implementation take?
Realistic timeline: 6–12 months for meaningful cycle compression. Data centralization (Stage 1) typically takes 2–3 months and is the most common bottleneck, not technology selection or model configuration. Gauge your starting point with the 7-question AI readiness checklist. Teams that skip data quality remediation and jump to AI modeling consistently fail to sustain their initial results, because the models pattern-match on dirty data and drift over time. Budget 3 months for Stage 1. It's not optional.
Will AI reduce FP&A headcount?
Eighty-eight percent of McKinsey-surveyed CFOs report no headcount reductions from AI (McKinsey, 102-CFO survey, 2025). The reallocation pattern is consistent across organizations: time shifts from data processing and model maintenance toward strategic analysis, investor relations, and scenario modeling. AI adds analytical capacity, it doesn't eliminate the people who act on that analysis. The teams that grow fastest after AI implementation are typically the ones that redeploy freed hours into high-leverage strategic work.
Comments